
🍽️ The Story in One Bite
Fresh 2025 data combined with eight years of UN FAO statistics reveals a sobering truth: 2.6 billion people—more than USA, Europe and China combined—cannot afford a healthy diet. While Chad faces costs of $4.85 per person daily, Norway achieves the same nutrition for $3.12. The difference isn’t food prices—it’s poverty. Our interactive dashboard maps this affordability crisis across 173 countries and 8 years of data, revealing which regions are improving and which are falling further behind.
🛒 Ingredients
- Data: UN FAO – Cost and Affordability of a Healthy Diet (CoAHD)
- Coverage: 173 countries & regions, 2017–2024
- Metrics: Cost of healthy diet (PPP-adjusted $/person/day), population unable to afford (millions)
- Tools: Google Colab, FAOSTAT, Interactive Dashboard (Code available here)
🍳 Instructions
- Clean & Prep: Load and process FAOSTAT data in Google Colab
- Reality Check: Adjust for discount-priced outliers (e.g., UK $2.56 → true cost ≈ $3.25/day)
- Visualize: Build a comprehensive dashboard to map affordability trends globally
👨🍳 Chef’s Notes
- 🌍 The Scale: 2.6 B can’t afford a healthy diet – populations of China, USA and Europe combined
- 💰 Too Pricey for Many: Low incomes—not just food costs—keep billions malnourished
- 📉 Regional Divide: Sub-Saharan Africa & island nations face the steepest affordability gaps
- 🛡️ Income Shields: Wealthier nations offset higher food costs with stronger social policies
- 📈 The Trend: A tiny ray of hope – the global trend is slightly declining compared to 2017
- 🗺️ Global View: Data offers a wide picture, though some countries/years lack full coverage
📊 Explore the interactive dashboard below
(or in fullscreen mode)
Cost and Affordability of a Healthy Diet
Comprehensive analysis of economic access to nutritious foods worldwide
Dashboard developed by Frank Bueltge for data-snack.com
Loading FAOSTAT Data…
Load Time: 0ms
Charts: 0/0
Global Cost (PPP)
$0.00
per person per day
Global Unaffordability
0%
of population
People Affected
0M
billion people affected
Average Cost
$0.00
average cost
Top 15 Most Expensive (Int$ PPP/day)
Loading chart…
Top 15 Least Affordable (%)
Loading chart…
Top 15 Most Affordable (Lowest Unaffordability %)
Loading chart…
Cost vs Affordability
Loading chart…
Complete Ranking – Cost (Int$ PPP/day)
| Rank | Region | Cost | Unaffordability | Affected (M) |
|---|
Complete Ranking – Unaffordability (%)
| Rank | Region | Unaffordable | Cost (PPP) | Affected (M) |
|---|
Hold Ctrl/Cmd to select multiple
Regional Comparison: Cost of Healthy Diet (PPP)
Detailed Data Overview
| Region | Cost (PPP) | Unaffordability (%) | Affected (Million) |
|---|
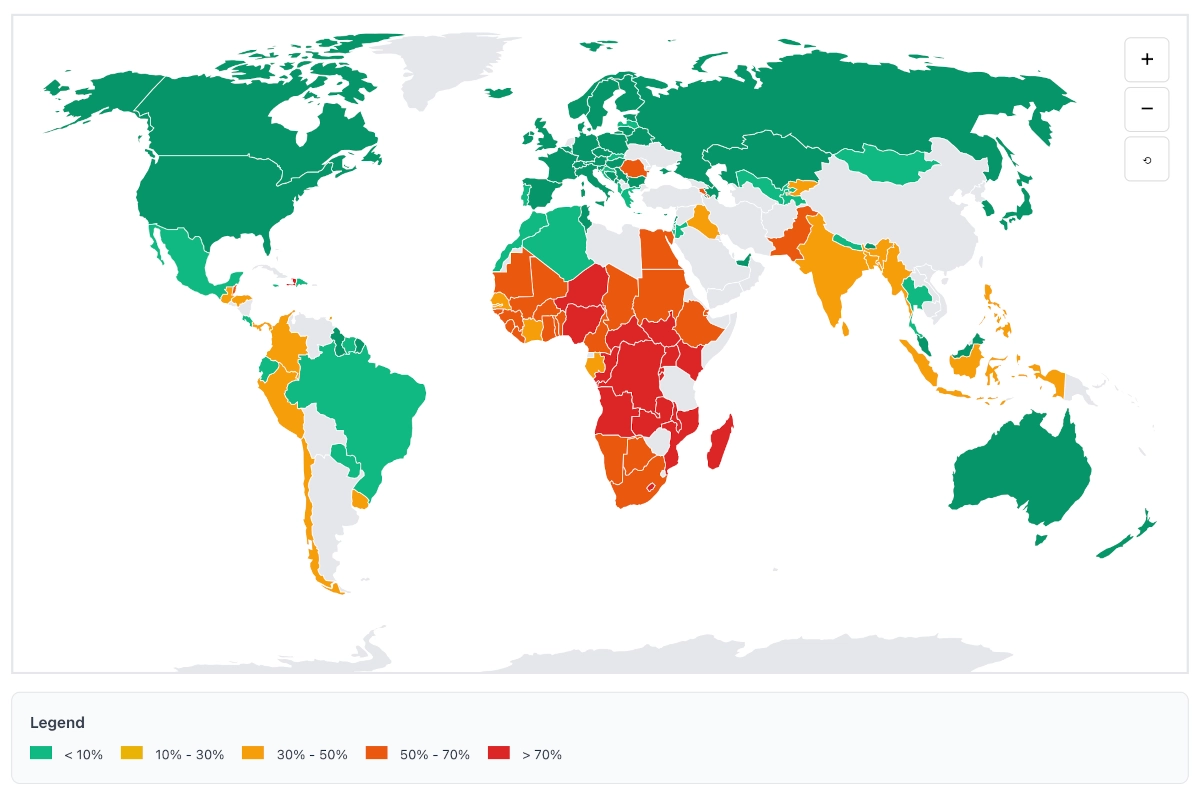
Global Cost of Healthy Diet – 2024
Legend
Country Data for Selected Year
| Country | Cost (PPP) | Unaffordability (%) | Affected (Million) |
|---|
Data Sources & Methodology
Healthy Diet Basket (HDB)
- • Energy Target: 2,330 kcal per day
- • Starchy Staples: 50% of dietary energy
- • Animal Foods: 13% (protein source)
- • Fruits & Vegetables: 12% combined
Data Sources
- • Primary Dataset: FAO Cost and Affordability of a Healthy Diet (CoAHD)
- • Price Data: International Comparison Program (ICP) 2021
- • Updates: National Consumer Price Index (CPI)
- • Coverage: 173 countries & territories, 2017-2024
- • Affordability: Based on World Bank poverty lines & income distributions
Source: FAO Statistics Division (FAOSTAT) |
Methodology: Food-based dietary guidelines using least-cost optimization approach |
Last Updated: August 2025 | Dashboard by Frank Bueltge for data-snack.com